The honest state of the Grand Rapids market right now
The median home in the City of Grand Rapids sold for about $305,000 over the three months through July 2026, up 2.5% year over year on Redfin's read. That is $5,000 above the $300,000 I published last month and a slower year-over-year pace than the 3.4% the same source was showing then. Houzeo's wider Grand Rapids cut prints $335,000 for July, up 1.55%. Both sources are decelerating and both still show appreciation.
I am publishing 2.5% as the year-over-year figure this month instead of blending the two city cuts, because Houzeo's series broke. Its July closed-sales count reads 1,664, up 155% from a year ago, its inventory count is up 103.75%, and its new listings are up 99.39%. Three counts roughly doubling in one year is a geography or methodology change, not a market. When a source's denominators move like that its year-over-year price change stops being comparable, so I left it out of the blend rather than averaging a broken number into a clean one.
Greenridge's brokerage footprint gives the clearest read on direction because it is one series measured the same way two months running. Over the window from July 30 to August 30 the average sale price came in at $386,401, against the $419,034 the same source showed for the window ending July 26, and sold price per square foot came in at $210 against $220. Sale price as a percentage of list landed at an even 100.0%, down 2.2 points from 102.2%. Greenridge tags those three changes as -$9,972, -$6, and -1.8% against its own comparison window, and none of them reconciles to the levels it published in July, so read the direction as reliable and the magnitude as uncertain. All three point the same way.
Kent County is the hole in this report and has been for three months. The public county snapshot still reads about $335,000 from a late-2025 cut and still has not refreshed, so I am carrying it forward unchanged again rather than dressing it up as current. For scale, Ottawa County next door reads $400,000 as of March 2026, up 4.1%, and Michigan statewide runs a $299,900 median, up 3.41%, with 1.15 months of supply and 37.85% of sales above list. Grand Rapids is pricier than the state and moves faster.
I publish this as a September 2026 report. The city price figures are tagged to July 2026, the brokerage activity figures to the window ending August 30, the rate figures to the Freddie Mac survey week ending August 27, and the county figure to late 2025. Public aggregators lag at different speeds, so I stamp each number with its own date.
Still a seller's market, and the first month it gave anything back
Months of supply sits at about 1.1, roughly a fifth of the five to six months that defines a balanced market. City listings still go pending in about 6 days and still draw around 6 offers on Redfin's count, and Redfin scores Grand Rapids 75 out of 100 on competitiveness. Nothing in that paragraph describes a buyer's market.
The pricing power numbers are where August gave something back. Greenridge's sale-to-list went from 102.2% to 100.0%, Houzeo's July cut reads 101.43%, and grrealestateinfo's July report reads 101%. Last month those same sources converged near 102%, so I moved the published figure from 102% to 101% to sit in the middle of the new spread. The share of Grand Rapids homes closing above list fell from 57.4% in June to 53.5% in July, down 3.9 points in a month.
Speed loosened on the one series that measures it consistently. Greenridge's days on market for sold homes went from 12 to 17. Redfin's days-to-pending held at six, and those two measure different things: pending speed on a clean, well-priced listing versus the average across everything that actually closed. Both can be true, and this month they are.
Inventory is still building and the build slowed sharply. Active listings on Greenridge's footprint read 1,643 for the window ending August 30, against 1,571 from the same source a month earlier, which is about 4.6% after July's 21%. New listings ran 483 against 463, up about 4.3%. The site tags those two with a +24.9% and a -2.0% change against its own comparison window, and neither reconciles to the levels it published last month, so I am using the levels and the arithmetic I can check.
So the loosening this month came from the demand side. Homes are taking 17 days instead of 12, they are closing at 100% of list instead of 102.2%, and 53.5% are clearing above ask instead of 57.4%, while the flow of new listings barely moved.
One number I am declining to publish: Houzeo's July page prints 0.75 months of supply. Months of supply is inventory divided by monthly sales, and Houzeo's sales count is the one that jumped 155% year over year, so a smaller supply figure falls straight out of the broken denominator. I carried 1.1.
By segment: entry, core, and where buyers actually win
The market splits hard by price tier and the heat runs opposite to what most buyers expect. The hottest band is entry level, under about $250,000, with a pending-to-active ratio near 179%, meaning more homes under contract than listed. Almost nothing new gets built at that price, which is why the band stays starved no matter what the rest of the market does.
The core band from roughly $250,000 to $500,000 carries the volume, with a pending ratio around 149%. Move-in-ready homes in Forest Hills, Hudsonville, and Zeeland go under contract in about 21 days. The $305,000 city median sits just above the entry line, so roughly half of city sales land at or below the core band's floor.
The move-up and luxury tier at $500,000 and above is the only major segment with breathing room, at about an 86% pending ratio and around 31 days on market. That is where I send buyers looking for room to negotiate, and August's forecast revisions sharpened the case. Moving from today's 6.66% to Fannie Mae's revised 6.8% fourth-quarter call costs a $600,000 buyer far more per month than a $250,000 buyer, so hesitation shows up in the upper tier first. The four places I actually look for room: homes priced $400,000 and up in transitional neighborhoods, any listing sitting 30 or more days, homes needing cosmetic updates, and the $500,000-plus tier broadly.
An honest caveat on this section. The pending ratios above come from the tier read I published in July and I have not independently re-measured them since, so treat the ranking as directional and the exact percentages as stale. What I can measure fresh this month, the above-ask share and the sale-to-list ratio, both softened, and softening normally reaches the top tier before it reaches the bottom one.
A structural note from GVSU's Seidman review still frames the year: metro home prices rose about 6% in 2025 after 7% in 2024 and are up roughly 40% since 2021 on a repeat-sales basis, while median prices grew only about 30% over that span. The gap is the sales mix tilting toward lower-priced homes, and it is the same effect that lets Greenridge's average sale price fall from $419,034 to $386,401 in a month while the city median rises $5,000.
City vs. the suburbs: where the focus footprint stands
The roughly $30,000 gap between the city at $305,000 and the county at $335,000 is the suburban story in one line, and it widens once you sort the submarkets I work in. Redfin refreshed several of these this month, which let me reconcile figures that had been resting on Zillow's typical-value reads alone. Three came down and one went up. The three that came down are source reconciliation rather than falling prices, and I would rather say that here than let a chart imply Grandville lost 3% in thirty days.
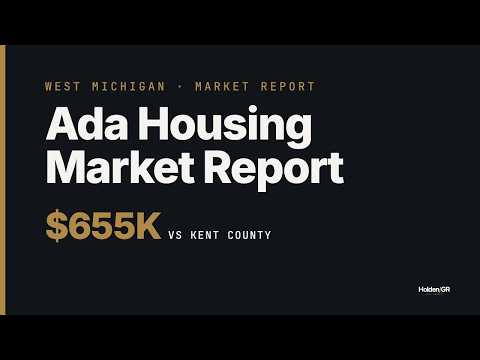
- Ada (Forest Hills), about $655,000. Zillow's typical value reads $654,671, up 4.6% year over year, carried with no refreshed sale median this month. Roughly double the county median, thin inventory, riverfront skews high. Read my Ada guide for the school-district detail.
- Cascade (Forest Hills), about $526,000, carried. Zillow's ZHVI reads $517,189 and the township sale median runs toward $535,000, so the published figure sits inside that band. Newer 4-beds near the river clear $650K+. See the Cascade guide.
- Byron Center, about $470,000, held between two reads that are $105,000 apart. Redfin's latest single-month median prints $510,000, up 17.3% on thin new-construction volume, while Zillow's broader-stock value reads $404,911. Holding puts the published number between them. Byron Center guide.
- Rockford, about $462,000, held and now bracketed closely. Zillow reads $461,550, up 5.4%, and Redfin's latest monthly average reads $455,000. Redfin's 24.6% year-over-year print on that average is thin-volume noise. Rockford guide.
- Allendale, raised to about $460,000 from $452,000 on a fresh Redfin read of $469,000 for the three months ending May, up 5.0%. GVSU town, heavy small-builder volume, days on market run long at around 60 into summer. Allendale guide.
- Caledonia, lowered to about $420,000 from $429,900. Both fresher reads sit below the trailing-12-month figure I was carrying: Zillow at $413,770 and Redfin's newest single-month median at $362,000, up 6.5%. I moved to the top of the fresher range rather than hold above all of it. New 3,000+ sqft builds reach $650K-$750K. Caledonia guide.
- Hudsonville, lowered to about $400,000 from $409,000 to reconcile a wide split. Zillow reads $406,763, up 4.8%, and Redfin's three-month sale median reads $344,000, up 7.2%. Both show appreciation and disagree on level by $63,000. Still one of the tightest markets anywhere at about 12 days. Hudsonville guide.
- Zeeland, about $380,000, held inside the current spread of Zillow at $395,539, up 4.5%, and Redfin's May city median at $342,795, up 7.1%. Zeeland guide.
- Jenison, about $371,000, held on Zillow's $369,805, up 3.5%. Redfin returned a $405,450 figure with no period attached this month and I am not using it. Jenison guide.
- Grandville, lowered to about $340,000 from $352,000 because the two sources converged. Redfin's three-month median reads $340,000, up 3.0%, and Zillow reads $338,101, up 1.8%, so they now agree within $2,000 and both sit below the figure I was carrying. Still pending in about 7 to 9 days. Grandville guide.
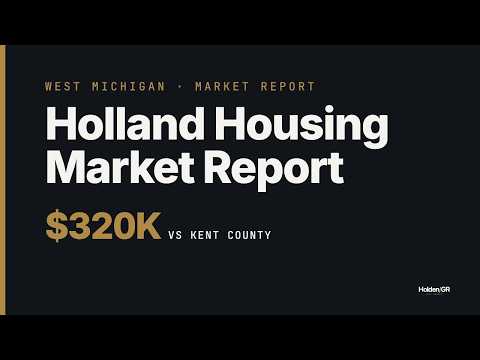
- Holland, about $324,000, held. Zillow reads $325,847, up 2.5%, and Redfin's March city median reads $310,000, with Ottawa County overall at $400,000, up 4.1%, as of March. Lake Macatawa frontage runs $600K to $2.5M+. Holland guide.
For metro completeness, the city core at about $305,000, Kentwood at about $340,000, and Wyoming at about $292,000 round out the population centers, all carried on split sources. East Grand Rapids still prints around $738,000 as a luxury contrast on a January read that has not refreshed in eight months, which makes it a ceiling reference rather than a market I lead clients toward. If you want a read on your own address, ask me for a CMA.
Rates and financing: the real cost of money for GR buyers
Rates did nothing in August and the forecasters did everything. Freddie Mac's survey printed 6.69% on August 6, 6.67% on August 13, 6.65% on August 20, and 6.66% on August 27, which is exactly where July ended. The 15-year finished at 5.98%. A year ago the same survey read 6.56% and 5.69%, so the 30-year sits 10 basis points above last summer and the 15-year sits 29 above.
On a $350,000 loan, principal and interest at 6.66% run about $2,249 a month, against about $2,226 at last summer's 6.56%. That difference of $23 is close enough to nothing that August was a month where the cost of money stopped being the variable.
The forecasts are the actual news. Last month I wrote that either rates would retrace toward the 6.0% to 6.5% consensus or the consensus would get revised up. It got revised up. Fannie Mae's August 19 outlook moved its fourth-quarter 2026 call from 6.4% to 6.8% and now carries 6.8% through the first half of 2027, with a 6.5% average for 2026 and 6.7% for 2027. The Mortgage Bankers Association moved from 6.5% for the back half of 2026 to 6.6% this quarter and 6.7% for the fourth quarter and all of 2027. The National Association of Realtors had already cut its 6.0% call to about 6.5% for the year. The band that read 6.0% to 6.5% in July reads roughly 6.5% to 6.8% now.
That changes the planning math more than the payment math. If you priced your search around a rate falling to 6% this fall, no major forecaster carries that assumption anymore. Fannie's 6.8% on a $350,000 loan works out to about $2,282 a month, roughly $33 more than today. Plan the payment around a high-6s rate through 2027 and treat anything lower as a refinance you get later. Forecasts are directional and get revised, which is the whole lesson of this month.
What I tell buyers has not changed. Latent demand is sitting just off market, so any real rate dip pulls those buyers back in and re-tightens a market that is only now giving buyers a little room. You would trade a slightly better rate for stiffer competition and a higher price. Buy the right house now and refinance the rate later if it comes.
Financing access for Michigan buyers: fit, not discounts
A few facts quietly determine what you can buy here. The 2026 conforming loan limit for Kent County is $832,750, the FHFA national baseline, up 3.26% from 2025, and the FHA single-family floor is $541,287. Practically the entire Grand Rapids single-family market finances inside conventional limits, so almost nobody here needs jumbo pricing. FHA at 3.5% down and VA at 0% down for eligible veterans are available metro wide. USDA's 100% financing only reaches the rural fringe rather than the urban core, so a specific address has to be checked against the USDA map.
For buyers with the income to carry a payment but limited cash up front, Michigan's MSHDA MI 10K DPA is worth knowing. It is up to $10,000 as a zero-interest second lien with no monthly payment, repaid when you sell, refinance, or pay off the first mortgage, and it is available statewide. It pairs with the MI Home Loan 30-year fixed, which can be FHA, VA, USDA, or conventional, with a sales-price cap of $544,233 that sits comfortably above nearly all entry and mid-tier Grand Rapids inventory. Eligibility runs on a 640 minimum credit score, first-time-buyer status, owner occupancy, county income limits in the range of $95,000 to $121,000 depending on county and household size, a homebuyer education course, and a 1% contribution from your own funds. Verify one thing with your lender before you count on it: the MI Home Loan Flex variant has been suspended intermittently.
With the forecasts now pointing at high-6s rates into 2027 rather than a fall retreat, the cash you keep at closing matters more than it did in the spring, because it is the buffer that absorbs a payment that will not shrink on schedule. I frame these as access and fit tools rather than a way to buy cheap. Confirm live program terms with a participating lender.
Inventory and new construction: where the homes are coming from
New construction is filling part of the gap and none of it at the bottom. Grand Rapids new-construction listings carried a median list price of $336,267 as of early June 2026, at about $280 per square foot on the city cut, while the wider metro new-build median runs near $444,374 across a $342,000 to $999,000 range. Resale is clearing around $210 per square foot on Greenridge's August window, down from $220 in July. New builds are a core-to-luxury product priced well above the resale market, which is exactly why the under-$250,000 band stays starved.
The subdivisions cluster in the suburban ring I work. Byron Center starts around $342,000 for 3 to 5 bedroom plans, Eastbrook communities across Caledonia, Byron Center, and Hudsonville run about $414,000 to $511,000, a new Eastbrook neighborhood in Rockford launches in 2026 around $414,000 to $450,000, and a 27-lot single-family project in Walker starts near $400,000. Eastbrook Homes and JTB Homes are the most active builders.
Standing inventory has now built for three straight months, and August's build was the smallest of the three. Active listings on Greenridge's footprint read 1,643 against 1,571 a month earlier, about 4.6%, after roughly 21% in July. New listings ran 483 against 463. So the extra inventory is coming from homes taking 17 days to sell instead of 12, rather than from a wave of new sellers.
On the permit side, single-family activity in the Grand Rapids-Kentwood MSA has held relatively stable against the national pullback. Kent County added more than 6,000 housing units across 2022 through 2024, with 1,000-plus multifamily units under construction during 2025, and metro home sales grew 13% in 2025 while sitting about 15% below 2019-2020 levels.
Buyers have measurably more to look at than they did in May, and the homes they are looking at are sitting longer. That is real, and it is still not enough to flip this into a balanced market this year.
2026 outlook: what I expect for buyers and sellers
I do not forecast crashes and nothing in this data supports one. Here is the honest read for the rest of 2026.
Prices: expect low-single-digit appreciation rather than a decline, and expect the pace to keep slowing. Redfin's city year-over-year read went from 3.4% to 2.5% in a month, Houzeo's wider cut reads 1.55%, and Michigan statewide runs 3.41%. With about 1.1 months of supply there is no inventory overhang to force prices down, even with standing listings up three months running.
Rates: the consensus band moved from 6.0% to 6.5% up to roughly 6.5% to 6.8%, and all three major forecasters revised in the same direction inside about six weeks. Plan your payment around a high-6s rate through 2027. If they are right, the tier that cools first is $500,000 and up, where payment sensitivity bites hardest.
For buyers: you have more to look at than at any point this spring, homes are sitting five days longer, and sellers are getting 100% of list instead of 102.2%. That is the most negotiating room this market has offered in a year, and it did not come from prices falling. Concentrate on the upper tiers, especially anything above $400,000 that has sat 30 or more days.
For sellers: you still have the advantage on supply and speed at 1.1 months and six days to pending, and that has not changed. What changed is that overpricing costs more than it did in June, because the average sold home is no longer clearing above list and the buyer looking at your house has a rate forecast telling them not to stretch. Price to the comps and this market still rewards you quickly.
The Chicago-to-Grand Rapids cost and tax differential keeps feeding move-in demand, and Corewell, Steelcase, Amway, Meijer, Perrigo, MillerKnoll, BDO, and Trinity Health keep the relocation pipeline steady. That demand floor is why I do not see prices breaking.
How I'd play it: buyer and seller strategy
If you're buying: get fully underwritten before you tour rather than pre-qualified, because with about six offers on a clean city listing the strongest financing package still wins ties. Re-run your pre-approval against a 6.8% fourth-quarter scenario rather than a 6% one, since no major forecaster carries a 6% handle anymore. Then hunt where the softening actually showed up: homes above $400,000 in transitional pockets, anything sitting 30 or more days, and cosmetic-update properties most buyers flinch at. For a read on a specific address, ask me for a CMA.
If you're selling: price to the comparable sales. The average Grand Rapids home closed at 100.0% of list in the window ending August 30, down from 102.2%, so the cushion that let a slightly high list price still clear over ask is gone this month. Move-in-ready condition in the core band from $250,000 to $500,000 is still the fastest path, and those homes in Forest Hills, Hudsonville, and Zeeland go in about 21 days. Start with a real number from my Home Valuation tool and we'll refine it against live comps.
Whatever side you're on, I won't push you. If the right move is to wait, I'll say so. If the data here didn't answer your question, ask it through Ask Holden and I'll give you the straight version.